
Reproducing Spielman (2020)
Reproducing Spielman el al. (2020)
Reproducing Evaluating social vulnerability indicators: criteria and their application to the Social Vulnerability Index by Spielman et al. returns resluts supporting the study. Spielman’s study developed methods to evaluate the internal consistency and construct validity of the Cutter, Boruff and Shirley (2003) Social Vulnerability Index (SoVI).
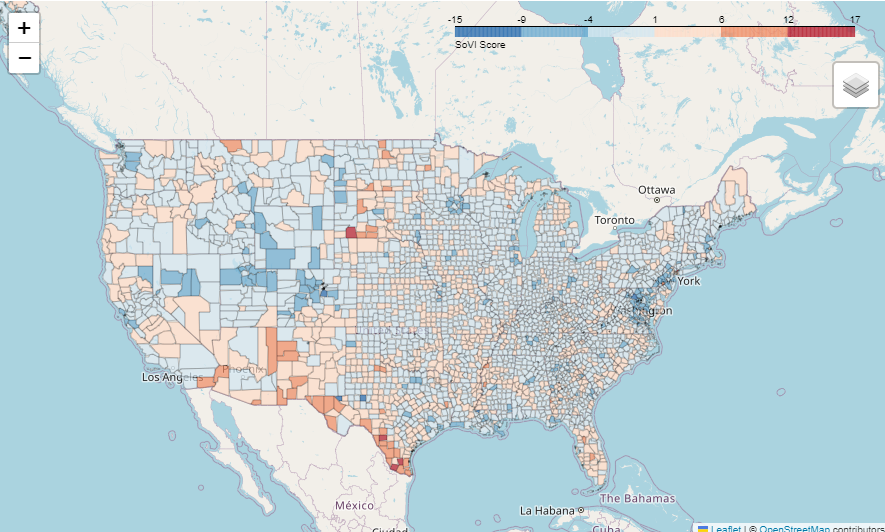
I spent most of my time with this study understanding how different component weightings affected consistency and variance. I contributed to the clarity of the study by producing an interactive map of the United States, enabling the visualization of vulnerability across the country. For example, the map helps answer questions about the figure below, and why there could be such a large range of vulnerability rankings for certain variables.
![]()
Our study was successful in reproducing every output dataset, instilling confidence in their results and the issues raised by their study about the internal and theoretical consistencies of SoVI.
Our updated paper can be found at this GitHub Repository. You can view it as a HTML Document here.