
Reproducing Malcomb (2014)
Takeaways from Reproducing Malcomb (2014)
Vulnerability, also called Household Resistance, is the main result calculated in Malcomb et al (2014). The vulnerability index visualizes the risk that hazards pose to different areas of Malawi, and is made up of a heirarchical design of 18 variables organized into three subindices, pictured below.
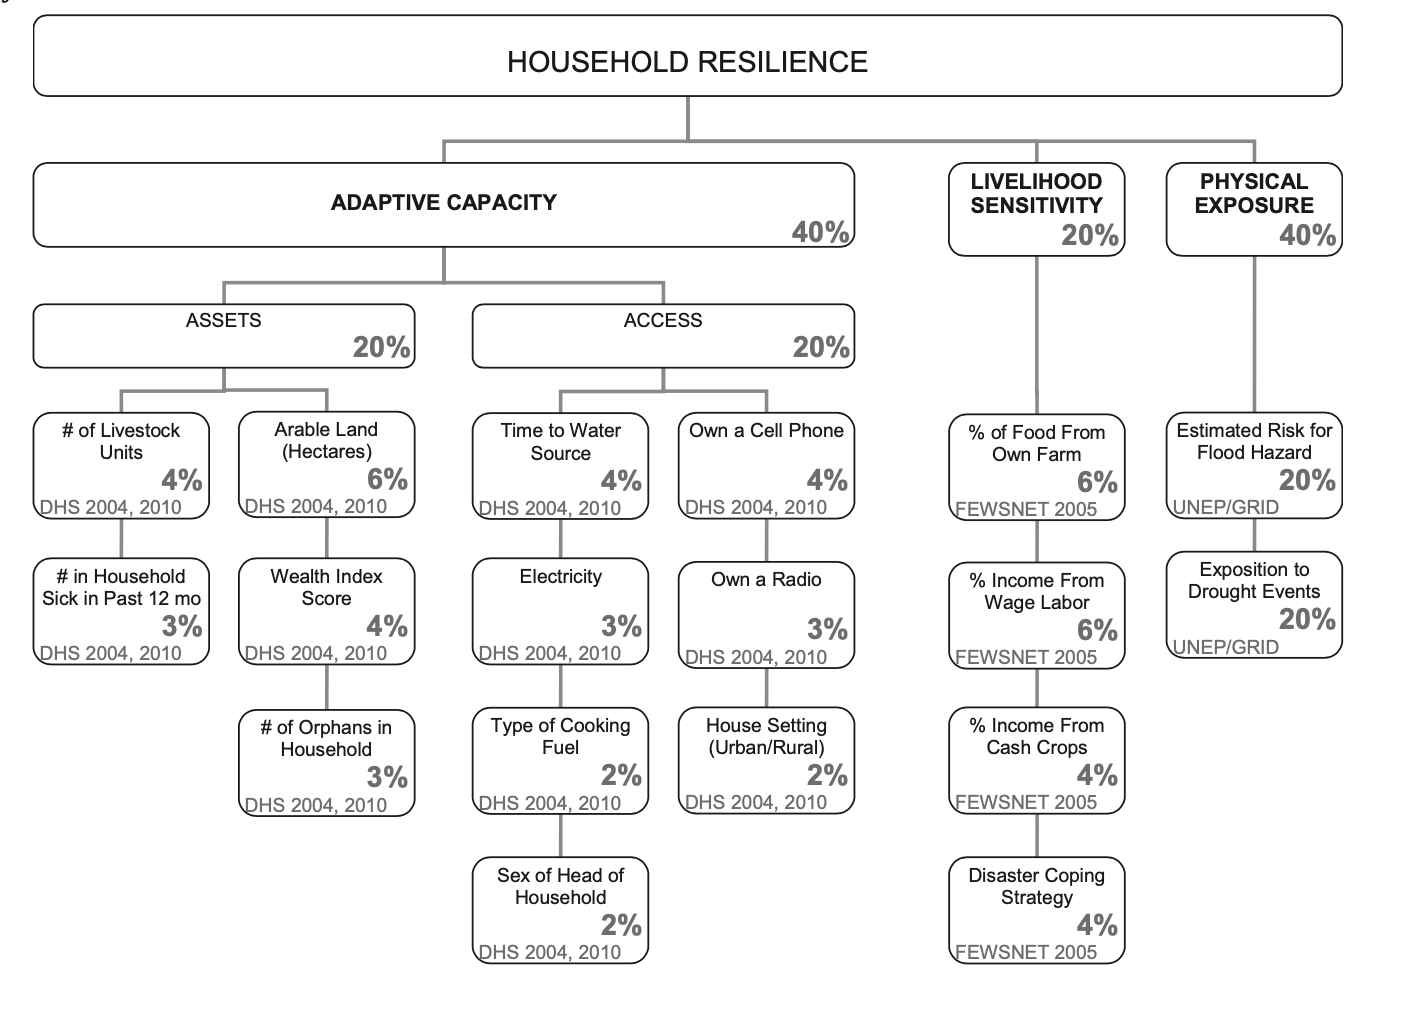 Vulnerability Index Model Composition
When replicating this study, I am most concerned by the handling and resolution of the drought risk and flood risk raster layers. The cell size of these rasters is neither included in the metadata nor noted anywhere else in the replication. This seems like a large oversight, especially because these two layers make up 40% of the final vulnerability index, as much as all of the surveyed factors contributing ot adaptive capacity, also at 40%. While I understand why the authors would have gone ahead with using these raster layers, I feel like the uncertainty they introduce, both in the low resolution and data source is glossed over.
The drought raster is essentially just a population map, because although touted as a global drought risk, the units are expected average annual population (2007 as the year of reference) exposed. This might be fine in the context of building an index concerned with number of people at risk or affected, but the vulnerability index is for the entire country of Malawi, and should not overrepresent areas with higher population.
The flood raster has its own problems, and is at a significantly lower resolution than all other data layers. When this layer gets baked into everything else and split into a higher resolution, a lot of uncertainty is introduced, made even worse by the fact that the layer is responsible for 20% of the total versability.
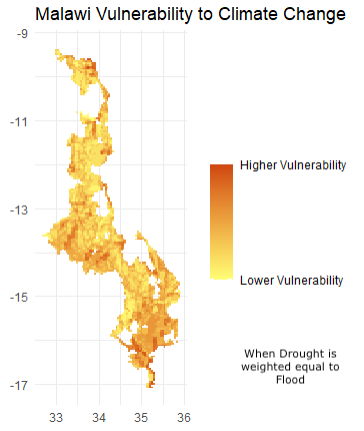
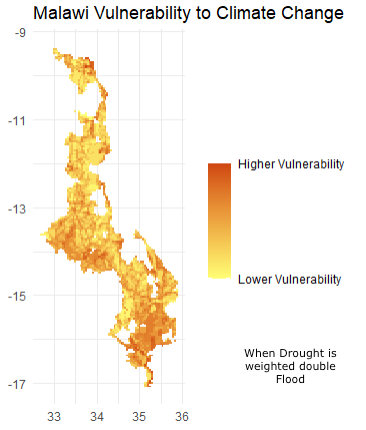
While I do not know exactly how much weight these layers should have in the Household Resilience Model, I do intuitively think that, because the flood map is half the resolution as the drought map, their weights should not be valued equally (drought map cell size is 4.6 and flood map cell size is 9.5km) So, just to see how much impact a change in the weight of the drought map would have, I will weight the drought map as double the weight of the flood map. To make up the total 40%, this means I will assign 13.333% to the flood map, and 26.666% to the drought map.
 |
 |
|---|---|
| When Drought and Flood are Weighted Evenly | When Drought is Weighted Double Flood |
By comparing these final images, it is clear that the weighting does make a difference to the overall vulnerability. While more could be said with statistics about how much difference, it seems that weighting Drought double increases overall vulnerability in the country.
In conclusion, I am not arguing that drought should make up 26.666% of the vulnerability index, and flood 13.333. Rather, I am just pointing out the discrepancy in the precision of the rasters in two layers that are weighted the same amount in the model. On top of this, it is worth reminding the reader that the drought raster is just a population map, and not a measure of rainfall across the world.
Notes from running the replication: There is a lot of correction code, like on line 342, where while we are gathering TAswe we also do specific filtering and selections, which I assume are necessary ways around errors found in the process. For example, the replication does not say how it was made aware of “an error on the east side of lake Malawi,” just what small filtering is needed to solve it. While I am sure the replicators could write hundreds of pages documenting their tireless troubleshooting and replication process, that would be much too detailed for 99.9% of readers, I am often left wondering how they caught small little hangups, like water clipping into TAs or other errors. I assume in this case that after every step, they map their polygons, and are able to visually confirm that everything looks as it should.
Our updated paper can be found at this GitHub Repository. You can view it as a HTML Document here.